

Understanding Candlestick Patterns: A Practical Guide
📈 Learn candlestick patterns to read market trends and price movements effectively. Get practical tips plus PDF guides ideal for Pakistani traders 🇵🇰 trading success.
Edited By
Isabella Turner
Bullish candlestick patterns offer a straightforward way for traders and investors to gauge when a market might be turning upwards. In Pakistan’s stock market or forex scene, recognising these patterns can mean the difference between a smart buy and a missed opportunity.
Candlestick charts, unlike simple line graphs, show the opening, closing, high, and low prices in a specific timeframe, making price movements clearer. Each candlestick consists of a body (the distance between opening and closing prices) and wicks (the lines showing highs and lows).
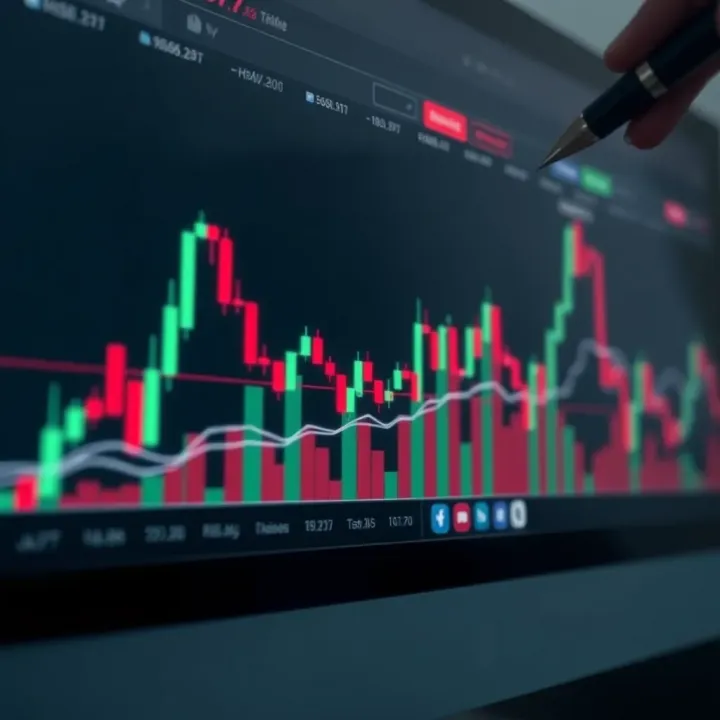
A bullish candlestick pattern typically signals that buyers are gaining control, pushing the price higher. This is particularly useful in volatile markets like Karachi Stock Exchange where sudden momentum shifts are common.
Here are some reasons why understanding these patterns helps:
Early entry signals: Traders spot upward trends before they fully develop.
Risk management: Knowing when buyers dominate guides stop-loss and take-profit points.
Better timing: Ensures you buy when odds favour a price rise, rather than guessing blindly.
Practical examples include the Hammer pattern, which shows a market rejection of lower prices, and the Engulfing pattern, where a larger bullish candle follows a bearish one, hinting at a turnaround.
Recognising bullish patterns can improve your trading strategy by giving a clearer picture of market sentiment, reducing guesswork.
In Pakistani markets, combining these signals with local factors like macroeconomic updates or political events strengthens your analysis. Additionally, using downloadable PDFs with pattern illustrations helps reinforce learning and quick reference during trading.
This guide will walk you through key bullish patterns, how to spot them, and apply them practically, so you can make informed decisions with confidence.
Understanding the basics of candlestick charts is essential for any trader wanting to navigate the ups and downs of financial markets effectively. These charts offer a clear visual summary of price action over a set period, making it easier to identify potential buying or selling opportunities. Candlestick charts provide a detailed picture of market behaviour, unlike plain line charts, which only show closing prices. This depth of information helps traders make more informed decisions.
A candlestick consists of a rectangular body and two thin lines called wicks or shadows extending above and below it. The body represents the price range between the opening and closing values during the selected time frame—say, one day or one hour. The wicks show the highest and lowest prices traded within that period. This simple structure provides a snapshot of how price moved, whether buyers or sellers controlled the market, and if there was strong volatility.
For example, a long body with short wicks typically suggests decisive moves in one direction. In Pakistan’s PSX markets, spotting a long bullish candle during a rising trend could mean strong buying interest pushing up stock prices such as those of MCB Bank or Fauji Fertiliser.
Every candlestick is based on four price points: opening, high, low, and closing price. The open price marks where trading started for the period, while the close price shows where trading ended. The high and low prices set the boundaries for that interval. Recognising these values quickly is handy for traders, as they indicate how prices behaved during the session.
For example, if the close price is higher than the open, the candle is bullish, suggesting buyers dominated. Conversely, a close lower than open signals selling pressure. These details help traders in Karachi or Lahore interpret daily stock movements more accurately.
Compared to bar charts or line graphs, candlestick charts are more visually intuitive. While bar charts also show the open, high, low, and close, their format is less immediate to read at a glance. Line charts simplify price action but hide valuable intra-day fluctuations. Candlesticks offer a balance—giving clear signals about market mood and momentum in just one glance.
This clarity is why many traders in Pakistan prefer candlestick charts when analyzing local commodities like cotton or oil, or stocks listed on PSX.
Candlestick patterns often reflect the tug-of-war between buyers and sellers. For instance, a hammer pattern (a candle with a small body and long lower wick) suggests sellers tried to push prices down but buyers stepped in strongly, potentially marking a reversal. This visual storytelling helps traders understand sentiment without digging through loads of data.
In Pakistan’s volatile market conditions, reading these patterns can warn traders of likely shifts in momentum before news or fundamentals catch up, offering a trading edge.
Candlestick charts are not just about prices—they illustrate the story of market psychology in real time, which traders can leverage to time their moves better.
Recognising key bullish candlestick patterns helps traders identify potential upward shifts in market sentiment. These patterns offer clear signals when the price may reverse from a downtrend, guiding entry points for buying. For Pakistani traders working within markets like PSX or Forex, knowing these patterns can sharpen decision-making under local conditions where economic data, political events, and investor psychology weigh heavily.
Hammer: This pattern appears after a downtrend and signals a potential reversal. The hammer has a small body near the top of the trading range with a long lower wick, resembling an actual hammer. It shows that sellers pushed prices lower but buyers regained control by the close.
In practice, you might see a hammer on a KSE-100 daily chart after a period of falls. Traders often wait for confirmation—such as a higher close the next day—to confirm an upward move. The hammer’s strength grows when trading volume increases, indicating stronger buying interest.

Inverted Hammer: This pattern also follows a downtrend but looks different. It has a small body near the bottom and a long upper wick. The shape suggests that buyers tried to push prices up but faced selling pressure, although they managed to hold the ground by closing near the open.
An inverted hammer found on a chart of a popular stock like OGDC (Oil and Gas Development Company) may caution traders of a possible trend change. Confirmation with higher close and volume is again crucial before acting.
Bullish Marubozu: This single candlestick lacks shadows or wicks on either end, meaning the open is the low and the close is the high. Such a candle displays strong buying momentum throughout the session.
In markets like Pakistan’s equity sector, spotting a bullish marubozu can signal sustained buying pressure, often during earnings season or after positive news. Traders consider it quite reliable, especially when it appears at support levels.
Bullish Engulfing: This two-candle pattern forms when a small bearish candle on day one is completely engulfed by a larger bullish candle on day two. This indicates a sudden surge in buyer interest overcoming previous selling.
For instance, traders might notice a bullish engulfing pattern in a commodity share like Engro Fertilizers after a period of consolidation, hinting at a fresh upswing. Such signals can prompt timely buying before broader market rallies.
Morning Star: A three-candle pattern where the first candle is bearish, the second is a small-bodied candle (indecision candle), and the third candle is bullish, closing well into the first candle’s body. This pattern represents a strong reversal from bearish to bullish sentiment.
Pakistani traders often find morning stars reliable when they occur near known support zones, such as government bond yields affecting banks’ stocks. It signals that buyers are gaining confidence after a pause.
Three White Soldiers: This consists of three consecutive long bullish candles with small or no lower shadows, each opening within the previous candle’s body and closing higher. It points to sustained buying pressure across three sessions.
Seeing three white soldiers on the daily chart of a growth-oriented stock can confirm a strong uptrend, especially if volume follows the move. In local context, this can be encouraging during periods when foreign investment flows into the market.
Recognising these candlestick patterns can significantly boost your ability to time trades in volatile Pakistani markets. Combining these patterns with volume and other indicators improves your chances of spotting real trend changes.
Interpreting bullish candlestick patterns requires careful attention to the local market context to avoid mistakes that can cost real money. Pakistani markets, like the Pakistan Stock Exchange (PSX), often exhibit behaviour influenced by economic news, geopolitical events, and sector-specific developments. Successful interpretation hinges on combining pattern signals with the overall market environment rather than relying on patterns alone.
Volume acts like the heartbeat of market movements and is crucial for confirming bullish patterns. A candlestick pattern that suggests a bullish reversal or continuation gains strength only when accompanied by an increase in trading volume. For example, if a bullish engulfing pattern appears on a PSX chart but volume remains dull or below average, the signal is weak and might not result in a sustained uptrend.
In the Pakistani context, sectors like FMCG or banking can show sudden spikes in volume during quarterly financial announcements or policy changes by the State Bank of Pakistan (SBP). Traders should watch for this volume surge alongside price action to validate bullish setups. Ignoring volume can lead you to trust patterns that don't reflect genuine buying interest.
Understanding whether the market is in a clear trend, sideways, or volatile state influences the meaning of bullish candlestick patterns. These patterns perform better as reversal signals when appearing after a noticeable downtrend. In a sideways or choppy market, the bullish pattern’s reliability decreases.
In Pakistan, market phases fluctuate a fair bit due to political uncertainty or foreign exchange volatility. For instance, a hammer candlestick after a steady decline in Textile sector stocks carries more weight, signalling potential bottoming out, than the same hammer appearing randomly during a stagnant phase.
False breakouts are a common trap where price briefly moves beyond a resistance level or previous high, triggered by a bullish candlestick pattern, only to retreat soon after. This can frustrate traders expecting a sustained rally.
Pakistani markets, with their susceptibility to sudden news—such as regulatory changes by SECP (Securities and Exchange Commission of Pakistan) or changes in import policies—can experience quick reversals after initial breakouts. To avoid falling for false signals, look for confirmation from the next few candles and volume; a strong breakout will usually maintain price levels and show healthy volume. Avoid rushing into trades immediately after a single bullish candle.
External economic forces can override technical patterns. Bullish candlestick setups sometimes fail because wider events dominate market sentiment. For example, if the government announces a hike in petrol prices or announces new taxes, bearish pressure might overcome bullish patterns even if technicals look optimistic.
Pakistani traders should always keep an eye on macroeconomic news such as SBP’s interest rate decisions, inflation data, or the pace of CPEC (China-Pakistan Economic Corridor) projects. These factors often dictate overall market direction and can render bullish candlestick signals ineffective temporarily. Combining fundamental awareness with technical analysis strengthens your trading decisions.
Successful trading in Pakistan’s markets comes from weaving together candlestick signals with volume, trend, and economic realities. Ignoring these can lead to costly mistakes, while respecting them improves your chances of spotting real opportunities.
This approach helps you stay grounded and trade more confidently rather than chasing patterns that lack meaningful support or context.
Using PDFs to study bullish candlestick patterns comes with clear advantages. Traders can keep a handy visual guide for quick reference, which helps during live trading or analysis. Since candlestick patterns require understanding specific shapes and formations, having these patterns documented in a concise PDF format simplifies the review process. For instance, a trader spotting a Morning Star or Bullish Engulfing pattern on their screen can immediately cross-check it with a PDF chart, ensuring better decision-making.
PDFs provide a compact and organised way to revisit key bullish candlestick patterns anytime. Unlike scrolling through lengthy web pages or videos, PDFs allow you to jump directly to the pattern you want to study and revisit examples without distraction. This makes continuous practice more effective, especially when learning to differentiate between closely related patterns like Hammer and Inverted Hammer.
Moreover, PDFs often include annotated charts and brief explanations, giving traders practical insights in a single glance. This makes it easier to build a mental catalogue of patterns, which helps when quick decisions are needed during market hours.
A printable PDF means traders can study wherever they want, even without internet access. Many Pakistani traders face frequent internet disruptions or prefer studying away from their screens, such as while travelling or during breaks. Printing a well-designed candlestick pattern PDF lets them annotate, highlight, or take notes on physical copies.
Offline study aids long-term memory retention better than digital-only learning. It also enables group study or discussions with peers or mentors without relying on gadgets. This approach fits well in Pakistan's diverse trading community, where practical, offline methods remain common alongside digital tools.
Many global and local trading education platforms offer free or paid PDFs focused on candlestick patterns. Websites like Investopedia, BabyPips, and reputable brokerage education sections provide well-structured materials vetted by experts. Such PDFs usually combine theory with real chart examples, covering pattern nuances in detail.
Pakistani traders can benefit by supplementing local stocks market details with global market examples, as patterns generally behave similarly. However, always verify the credibility of the source before relying heavily on their teaching material.
Local platforms focusing on Pakistani markets occasionally provide downloadable PDFs tailored for conditions here. For example, educational sections on PSX (Pakistan Stock Exchange) or websites from major brokers often distribute guides catering to Pakistani trading habits and market peculiarities.
Platforms like ProPakistani or TradingWithRay might offer Urdu-English bilingual resources or pattern explanations taking into account Pakistan’s market timings, volatility, and economic events. Accessing PDFs from such sources helps traders connect pattern theory directly to their trading experience in Pakistan’s unique market environment.
Keeping PDFs that reflect both technical accuracy and local market context can save you time and improve your trading confidence significantly.
Candlestick patterns alone offer valuable insights into market sentiment, but their reliability increases significantly when combined with other technical analysis tools. In Pakistani markets, where external factors like geopolitical events or economic indicators can cause sudden price swings, this integration helps traders reduce false signals. Employing complementary tools such as the Relative Strength Index (RSI), moving averages, and volume analysis sharpens entry and exit decisions, and builds stronger confidence.
Candlestick patterns often mark potential reversals or continuations, but without confirmation, entering a trade could be risky. RSI, which measures momentum on a 0 to 100 scale, acts as a companion by showing if a stock or index is oversold or overbought. For example, spotting a bullish engulfing pattern near RSI values below 30 strengthens the case for a buy, indicating the asset might be ready for an upward move. Meanwhile, the moving average helps identify the prevailing trend. A bullish candlestick pattern forming near a 50-day or 200-day moving average can signal a good entry point.
For exits, combining bearish reversal patterns with an RSI above 70 or a price crossing below a moving average might warn of a downturn. Thus, cross-referencing candlestick signals with RSI and moving averages can lower chances of entering or exiting trades prematurely.
Using multiple indicators together reduces guesswork and increases confidence that a trade setup is valid. For instance, you might see a Morning Star candlestick pattern on the PSX KSE-100 index, but if the RSI registers around 40 and the price remains above a rising 50-day moving average, you’re more likely to trust that upward trend continuation.
This layered approach also helps avoid emotional trading, which is common in volatile markets. When the technical tools align with the candlestick signals, traders have a firmer ground for decisions, particularly in uncertain economic periods, such as during rupee fluctuations or political instability in Pakistan.
Volume tells a compelling story about the strength behind price moves. A bullish candlestick pattern confirmed by a volume spike suggests genuine buying interest, not just a fluke. For example, if a Bullish Marubozu appears on a WAPDA stock chart accompanied by a sudden rise in volume, it supports the idea that large buyers are entering the market.
On the other hand, if volume remains low during a bullish pattern, the signal might be weak, and traders should be cautious. In Pakistan’s markets, where retail participation varies widely, recognising volume surges is especially useful for spotting institutional activity.
Price action, when studied alongside candlestick formations, reveals the ongoing market momentum. Momentum indicates whether buyers or sellers are controlling the market. A pattern like Three White Soldiers, backed by rising volume and price action making higher highs, confirms strong bullish momentum.
This understanding helps traders avoid traps where the price might bounce temporarily but lacks momentum to sustain gains. Observing both momentum and volume together offers a clearer picture of potential trend strength, helping investors on PSX or commodities markets make better timing decisions.
Integrating candlestick patterns with key indicators and volume data creates a more reliable and comprehensive trading strategy. This approach helps Pakistani traders navigate complex market conditions with greater assurance.
📈 Learn candlestick patterns to read market trends and price movements effectively. Get practical tips plus PDF guides ideal for Pakistani traders 🇵🇰 trading success.

📊 Explore key candlestick patterns in trading—bullish, bearish, and neutral signals with examples. Master setups to sharpen your analysis and improve decisions!
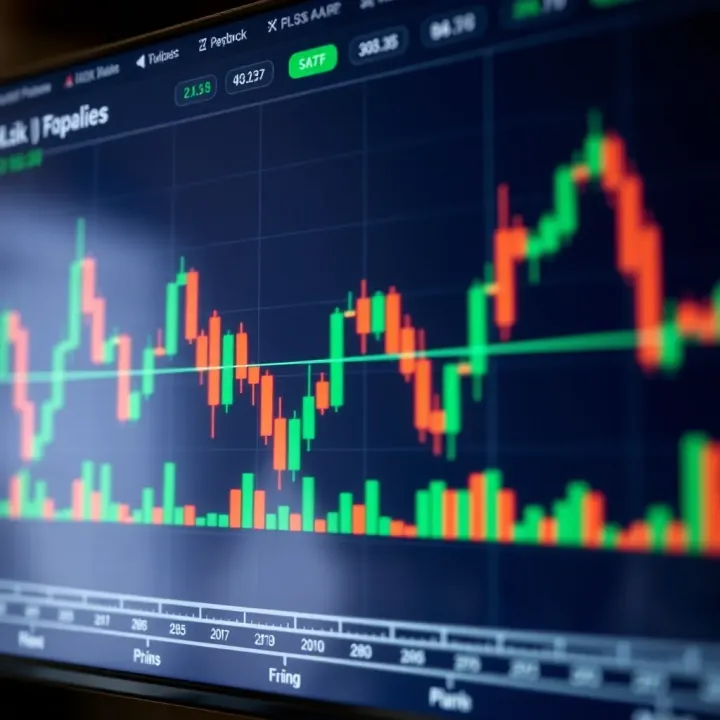
Learn to read candlestick patterns like a pro 📈 This guide covers basics to advanced setups with PDF resources, perfect for traders in Pakistan 🇵🇰

Master advanced candlestick patterns 📈 to spot market trends and seize trading opportunities. Enhance your analysis skills for better decisions today!
Based on 12 reviews