

Complete Guide to Candlestick Trading Patterns
📊 Explore key candlestick patterns in trading—bullish, bearish, and neutral signals with examples. Master setups to sharpen your analysis and improve decisions!
Edited By
Charlotte Mason
Candlestick patterns are a practical tool for understanding price action in financial markets, helping traders and investors make smarter decisions. Unlike line charts that show only closing prices, candlestick charts display the open, high, low, and close prices for each trading period, delivering a fuller picture of market sentiment.
Originating from Japanese rice markets centuries ago, candlestick patterns remain popular in Pakistan’s stock and forex markets today. They visually represent traders’ hopes, fears, and momentum swings in a straightforward way.
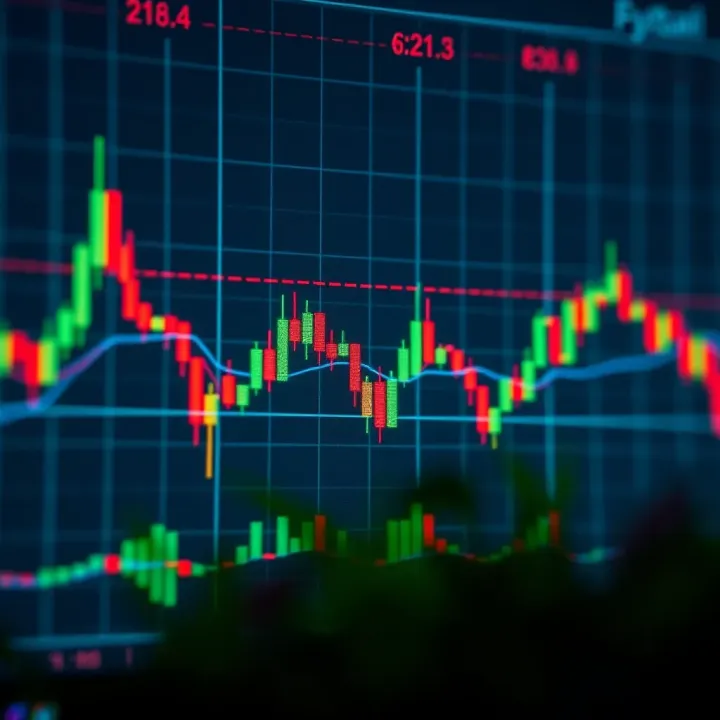
The body shows the difference between opening and closing prices.
The wick or shadow displays the highest and lowest prices.
A green or white body means prices closed higher; red or black indicates a decline.
Understanding these elements lets you read price trends more clearly than many other forms of analysis.
Candlestick analysis is as much about psychology as price: it reflects the ongoing battle between buyers and sellers.
For example, a Doji — where the open and close are almost equal — suggests indecision, often signalling a possible reversal. Meanwhile, a Hammer pattern, with a small body and long lower wick, can point to a potential bullish turn after a downtrend.
In the Pakistani context, combining candlestick insights with local market behaviour and economic events enriches trading strategies. For instance, patterns near key PSX support or resistance levels, or around budget announcements, provide extra clues.
To make learning easier, downloadable PDF guides summarising common patterns, their meanings, and chart examples are quite helpful. These PDFs serve as handy references for quick review during live trading, building confidence and reducing errors.
Step-by-step explanations of essential candlestick patterns with fresh, Pakistan-specific examples.
Practical tips on how to spot these patterns in real charts and interpret their signals accurately.
Advice on combining candlestick signals with other indicators and volume data for stronger trading setups.
Guidance on using the provided PDF resources to reinforce your skills offline.
Mastering candlesticks is not about memorising endless patterns but recognising high-probability signals to manage trades effectively and boost profitability.
Next, we will explore the basics of candlestick chart construction to solidify your foundation for practical use.
Candlestick charts are widely used in trading and investing because they offer a visual summary of price action within a specific time frame. Their structure makes it easier to identify market sentiment, price direction, and potential reversal points compared to simple line charts. For Pakistani traders dealing in PSX stocks or commodity markets, understanding these basics can improve timing decisions and risk management.
Price movements in a set time period are the foundation of candlestick charts. Each candlestick corresponds to a fixed interval — for example, one day, one hour, or even one minute — depending on the trader’s preference. This feature helps traders see how prices fluctuated within that period rather than just the closing price. Imagine watching KSE-100 index moves during a trading session; multiple candlesticks depict the price swings, giving real insight into intraday volatility.
The open, close, high, and low prices shown by the candlestick provide a detailed snapshot of each time segment. The open price marks where trading began, the close price is the last traded price, while the high and low indicate the maximum and minimum trades during that time. For example, a candle showing a higher close than open suggests positive momentum, which could be an early sign of a bullish trend, especially if supported by larger volume.
The visual parts of a candlestick are the body and the wick (or shadow). The body represents the price range between the open and close within that interval. A long body means strong price movement, signalling buyer or seller dominance. For instance, a large bullish body in a stock like Engro signals buyers pushed the price higher definitively during that session.
The wick stretches above and below the body, showing the highest and lowest prices reached but not sustained. Long wicks reveal price rejection at extremes, hinting at potential reversals. If a candle has a long upper wick but closes near its open, it means the market tested higher levels but sellers took control towards the end.
Bullish and bearish impressions are signalled by the candle’s body colour or shading. Typically, a green or white body shows a bullish candle where closing price exceeds the opening, meaning demand outweighed supply. Conversely, a red or black candle indicates bearish sentiment, where sellers pressured the price down by session end. Recognising these helps traders decide when to enter or exit positions and manage risks accordingly.
Understanding these core elements enables traders to read charts like a story, identifying when markets are steady, volatile, or about to shift direction. This skill is essential for making informed choices rather than just guessing based on price alone.
Mastering Basics of Candlestick Charts sets the stage for spotting key patterns and integrating them with other tools for practical trading success.
Understanding common candlestick patterns is essential for traders seeking to decode market sentiment and make informed decisions. These patterns reveal shifts in supply and demand, often signalling potential reversals or continuations in price trends. Recognising these patterns early provides a practical edge, helping you spot trading opportunities and manage risk effectively.
A Doji candlestick forms when the opening and closing prices are almost the same, resulting in a very thin or nonexistent body with long wicks. It represents indecision in the market where buyers and sellers are nearly balanced. For example, during a bullish run, a Doji appearing near a resistance level can hint that the upward momentum is weakening and a reversal might be on the cards.
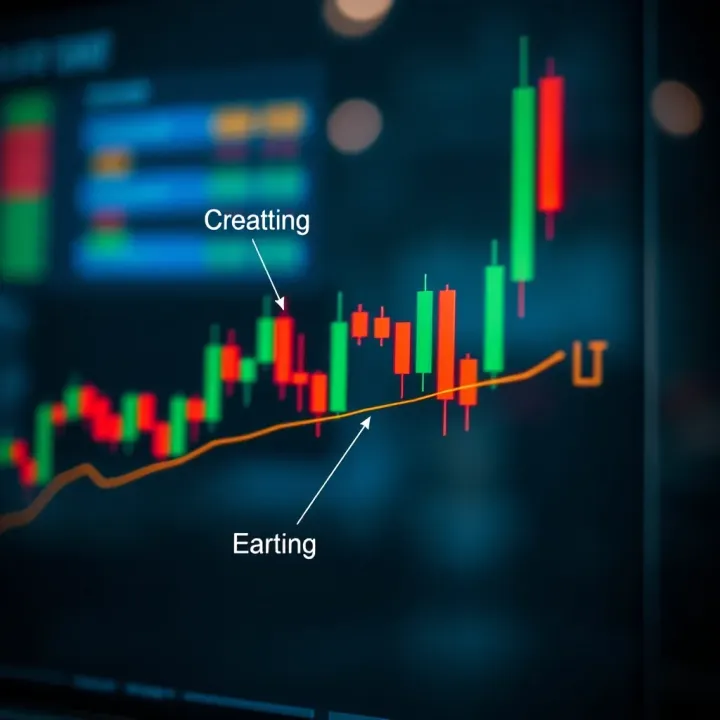
Traders use Doji signals carefully as confirmation from subsequent candles or other indicators is required before acting, since it only shows market hesitation rather than a definitive move.
Both the Hammer and Hanging Man have small bodies with a long lower wick, but their meaning depends on the previous trend. A Hammer occurs after a downtrend, suggesting buyers are stepping in as prices dip but then recover, signalling a possible bullish reversal. Conversely, a Hanging Man emerges after an uptrend, indicating selling pressure that might lead to a bearish turn.
In Pakistani markets, these patterns offer useful signals, especially in volatile conditions; for instance, a Hammer during a Karachi Stock Exchange (KSE) dip might prompt traders to prepare for a bounce.
A Shooting Star has a small body near the bottom with a long upper wick and occurs after an uptrend. Its shape shows that buyers pushed prices higher but sellers took control towards the close, suggesting a potential trend reversal to the downside.
This pattern acts as an early red flag, allowing traders to plan exits or protective stops. Seeing a Shooting Star on popular stocks like PSX-listed companies can help investors avoid holding through a downturn.
The Engulfing pattern involves two candles where the second candle completely 'engulfs' the first in real body size. A Bullish Engulfing after a downtrend signals buyers overpowering sellers, while a Bearish Engulfing after an uptrend points to sellers gaining the upper hand.
In practice, this pattern offers stronger reversal confirmation than single-candle signals. For instance, spotting a Bullish Engulfing on oil stocks during market dips may prompt buying interest.
Both are three-candle patterns. The Morning Star appears after a downtrend and suggests a bullish reversal: a small-bodied candle signals indecision, followed by a strong bullish candle. The Evening Star, opposite in formation, indicates a bearish reversal after an uptrend.
These patterns are valuable for timing entries and exits, especially when combined with volume analysis or moving averages. Traders in Pakistan’s equity market often look for these formations to confirm trend changes.
The Three White Soldiers pattern consists of three long bullish candles with consecutive higher closes, showing sustained buying pressure. On the flip side, Three Black Crows are three long bearish candles signalling strong selling.
Spotting these patterns can affirm trend strength and guide traders on holding positions or taking profits. For example, after a series of three white soldiers emerges on a promising sector in PSX, investors may consider holding or adding to positions.
Recognising these common candlestick patterns equips traders with actionable insights. Coupling them with other tools enhances accuracy, helping to navigate Pakistan’s unique market dynamics confidently.
Candlestick patterns give you visual cues about market sentiment, but relying on them alone isn't enough to make solid trading decisions. Their real power shines when combined with other technical tools and proper risk management. This approach helps you confirm signals, avoid traps, and manage your trades smartly. In Pakistan's volatile markets, where sudden price jumps or reversals happen often, this multi-layered method can protect your capital.
Volume analysis shows the number of shares or contracts traded within a time frame. When you spot a candlestick pattern, see if volume backs it up. For example, a bullish engulfing pattern with increasing volume signals strong buying interest, making the reversal more trustworthy. On the other hand, the same pattern with low volume might be a weak signal prone to failure.
Volume spikes during breakout patterns often indicate genuine moves, while thin volume could point to a fakeout. So, it's wise to check trading volumes from Karachi, Lahore, or Islamabad stock exchanges before acting boldly on patterns alone.
Moving averages smooth out price action to reveal trends. Common ones are the 50-day and 200-day moving averages. When candlestick patterns form near these averages, they carry extra weight. For instance, a hammer candlestick appearing near the 200-day moving average support is more likely a strong buy signal.
Traders keep an eye on whether prices cross moving averages after certain candlestick formations. If a bullish pattern aligns with price moving above a key average, it suggests momentum is shifting upward, ideally confirming the pattern’s prediction.
Relative Strength Index (RSI) and Moving Average Convergence Divergence (MACD) are popular momentum indicators. RSI helps spot overbought or oversold conditions, whereas MACD highlights momentum shifts.
Suppose a shooting star forms, showing potential reversal, and RSI reads above 70 (overbought) — this convergence suggests a stronger sell signal. Similarly, a bullish engulfing pattern followed by a MACD crossover to the upside can confirm the start of a new uptrend.
Stopping losses early is crucial to prevent damage to your trading capital. Candlestick patterns can guide where to place stop-loss orders logically. For example, after a bullish hammer, a stop-loss just below the candle’s low limits risk if the market reverses unexpectedly.
In Pakistan’s markets, where unexpected news or political shifts can cause sharp swings, well-positioned stop-losses safeguard against sudden downturns, letting you trade with confidence.
Once in a trade, setting profit targets based on candlestick patterns and support-resistance zones helps lock gains. Using a morning star pattern, for example, you might set a target near a previous resistance level visible from the chart.
Having clear targets avoids emotional decisions during volatile sessions on PSX or in Forex trading, keeping your strategy disciplined.
Candlestick patterns can sometimes mislead, especially in low volume or choppy markets. To avoid false signals, confirm patterns with other indicators, wait for closing prices rather than intraday wicks, and watch out for news that could distort technical signals.
Smart traders also use time filters, ignoring patterns that appear during low liquidity hours. Besides, combining patterns with volume, RSI, and moving averages helps filter out noise, which is vital to succeed amid Pakistan’s unpredictable market conditions.
Using candlestick patterns wisely means blending them with other signals and managing your risks properly. This method turns patterns from mere pictures into powerful trading tools that fit Pakistan’s dynamic trading environment.
Candlestick pattern PDFs serve as practical tools for traders who want quick and reliable access to chart analysis techniques. They compile essential information in a portable format, allowing users to study market signals without needing an internet connection. In Pakistan, where internet access can be inconsistent especially in smaller towns, having PDF guides offline is particularly valuable for traders who want to keep learning on the go.
PDF guides act as handy references that you can consult anytime during trading sessions. For example, a trader in Lahore might keep a PDF open on their laptop during market hours to quickly confirm if a hammer or doji pattern has formed. This immediacy helps to make informed decisions fast, without switching between multiple websites that may load slowly during rush hours. PDFs can also be saved on tablets or mobiles, letting traders review material while commuting or during load shedding when internet is unavailable.
Unlike scattered articles or random notes, PDF guides offer a well-organised approach to learning candlestick patterns. They often start from basics and progress towards more complex formations, making it easier for beginners to follow. For instance, a structured PDF might categorise patterns by their effectiveness for intraday versus long-term trading, which helps investors tailor their study according to their trading style. This structured layout also allows educators and trading coaches in Pakistan to use these resources in classrooms or online courses systematically.
Many Pakistani brokerage firms and international platforms provide free PDF resources as part of their educational material. These official platforms ensure the content is accurate and aligned with current market practices, which reduces the chance of confusion. For example, brokers like PSX or companies connected with the Pakistan Stock Exchange may offer downloadable PDFs covering candlestick basics as part of their client support sections.
Several financial education websites in Pakistan publish up-to-date PDFs specifically designed for local traders, considering regional market conditions and time zones. Brokerage firms such as MCB-Arif Habib Savings & Investments or Alfalah Securities often produce educational PDFs that integrate practical trading tips with candlestick charts applicable to both PSX and international markets. These PDFs are tailored to address common trading challenges faced by Pakistani investors, making them reliable sources for study.
PDFs are most useful when paired with actual market trading. Reading about patterns alone is not enough—traders should open charting software and apply the PDFs’ insights in real-time, like spotting an engulfing pattern on the Karachi Stock Exchange. This active application reinforces learning and builds confidence in recognising trends and signals.
Market behaviour evolves, and new variations of candlestick patterns emerge over time. Traders should look for updated PDFs or revised editions from credible sources to stay current. Pakistani trading communities and forums often share fresh educational resources, so bookmarking the latest PDFs and reviewing them every few months helps keep skills sharp and relevant.
Having a reliable PDF guide is like keeping a trusted map while navigating the often confusing world of stock charts. With consistent practice and timely updates, it becomes an invaluable companion on your trading journey.
📊 Explore key candlestick patterns in trading—bullish, bearish, and neutral signals with examples. Master setups to sharpen your analysis and improve decisions!
Learn to read candlestick patterns like a pro 📈 This guide covers basics to advanced setups with PDF resources, perfect for traders in Pakistan 🇵🇰

Master advanced candlestick patterns 📈 to spot market trends and seize trading opportunities. Enhance your analysis skills for better decisions today!
📈 Master 35 key candlestick patterns to boost your trading skills. Learn their traits and get a handy PDF for quick chart reading anywhere! 🕮
Based on 9 reviews