
Choosing the Best Indicator for Forex Trading
Learn how to pick the best Forex trading indicators 📈 for your strategy. Discover types, popular options & tips to improve your market moves.
Edited By
Daniel Foster
Gold trading charts are essential tools for anyone dealing with gold investment or trading, especially in Pakistan's fluctuating market. These charts display gold price movements over time, helping investors spot trends and make informed decisions. Whether you are trading gold futures, monitoring spot prices, or looking at local rupee-denominated rates, understanding these charts is key.
There are three main types of charts commonly used:
Line charts: These show the closing price over a selected period with a simple line. They are straightforward but may miss intraday fluctuations.
Bar charts: Each bar displays open, high, low, and close prices, giving a fuller picture of daily price action.
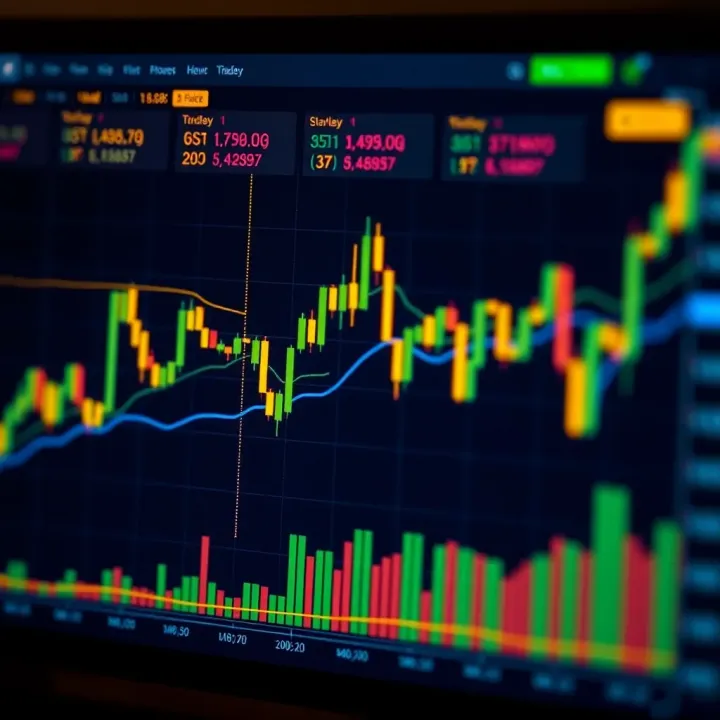
Candlestick charts: Similar to bar charts but more visual, candlesticks show bullish or bearish moves with coloured bodies, making trend identification easier.
For Pakistani investors, candlestick charts are widely preferred due to their clarity, especially when analysing gold prices quoted in PKR or USD.
You should also focus on key indicators that traders use along with charts:
Moving Averages (MA): They smooth out price data to highlight trends over periods like 20, 50, or 200 days.
Relative Strength Index (RSI): This measures speed and change of price movements, signalling overbought or oversold conditions.
Volume: Trading volume confirms price strength; for example, a gold price rise on high volume is more credible.
By observing these indicators on gold charts, you can identify potential entry or exit points. For instance, if the 20-day MA crosses above the 50-day MA, it indicates a bullish trend that could be a good buying signal.
Also, know common chart patterns that frequently occur in gold trading:
Head and Shoulders: Often signals trend reversal.
Double Top/Bottom: Indicates strong resistance or support.
Triangles: Shows price consolidation before breakout.
These patterns, when spotted early, can help traders anticipate future price moves.
Understanding gold trading charts does not require complex tools but a keen eye and consistent practice. For Pakistani investors navigating both local market influences like PKR-US dollar fluctuations and global factors such as geopolitical tensions, chart analysis offers a reliable way to keep track.
In the next sections, we will explore how to read these charts effectively, interpret indicators, and apply this knowledge to real trading scenarios.
When it comes to gold trading, understanding the various chart types is essential. Each chart displays price movements differently, helping traders and investors spot trends, volatility, and potential entry or exit points. Pakistani investors, in particular, benefit when they can read charts accurately, especially given the local rupee fluctuations and import duty impacts on gold price.
Line charts show a straightforward representation of gold prices over a specific time frame. They connect closing prices from each period with a continuous line, making it easy to track overall direction. For instance, if you’re monitoring daily gold prices over a month, a line chart effortlessly highlights the general upward or downward momentum.
Because they strip away complex details, line charts are ideal for identifying broad trends. If you want a quick glimpse of how gold has generally moved in recent weeks without getting bogged down by intra-day changes, line charts do the job well. Pakistani traders looking for clear trend directions during volatile market phases may start with line charts before moving to more complex formats.
Candlestick charts are widely preferred because they convey more information visually. Each candlestick has a body and wicks (shadows). The body colour indicates the price direction: generally, a green (or white) candle means the price closed higher than it opened, while a red (or black) candle shows a price decline.
Every candlestick shows four crucial prices: the opening, closing, highest, and lowest within a given time. For example, a candlestick for one hour will tell if gold opened at Rs 120,000, hit a high of Rs 121,000, a low of Rs 119,500, and closed at Rs 120,500. This detail is valuable when you want to assess market momentum and price swings within short periods, which line charts cannot provide.
Bar charts share similarities with candlesticks but look different. Each vertical bar symbolises the price range during a specific period, showing the high and low by the length of the bar. Horizontal ticks on either side of the bar indicate opening price (left tick) and closing price (right tick).

Compared to line charts, bar charts offer much richer price information. Though they lack the colour-coding of candlesticks, they help traders understand price movements clearly. For those preferring a less colourful but data-dense chart, bar charts serve well.
Bar charts also highlight price volatility effectively. Longer bars mean higher price swings within the timeframe, useful for spotting volatile trading sessions. In Pakistan’s gold market, where prices can jump due to currency swings or global events, bar charts can signal when uncertainty is high.
Choosing the right chart type depends on your trading style and information needs. A beginner might start with line charts but gradually learn candlestick and bar charts to read market signals more accurately and make better decisions.
When you look at gold trading charts, certain key elements help make sense of price movements and trading behaviour. Understanding these aspects enables investors and traders to spot opportunities and risks more clearly. Let’s break down the main factors you should focus on while reading gold charts.
Choosing the right time frame is central to effective chart analysis. Shorter time frames like 5-minute or 15-minute charts suit day traders who want to catch small price swings. In contrast, investors aiming for longer-term gains typically rely on daily or weekly charts to avoid noise and see the overall trend more clearly. For example, a trader using a 1-hour chart might react quickly to small price jumps, while someone following a weekly chart might hold their position through minor drops.
Apart from time frames, recognising support and resistance levels is vital. Support is a price point where gold tends to stop falling because buyers step in, acting like a floor. Resistance, meanwhile, is the ceiling where selling pressure increases, often slowing upward moves. These levels don't appear magically; repeated tests of a price—say, gold hitting Rs 200,000 per 10 grams and bouncing back—signal support. Traders set buy orders near support and sell near resistance to manage risks more effectively.
Trade volume, the total number of gold contracts or ounces exchanged, adds depth to price charts. A rising gold price backed by high volume suggests genuine buying interest, while the same price increase on low volume may be weak or misleading. Consider a scenario where gold prices climb steadily but volume remains low; this might warn you about the sustainability of the move.
Sudden volume spikes often indicate important market shifts. For instance, a sharp volume rise during a price drop could mean sellers are offloading their positions, signalling a potential reversal. Conversely, if a volume spike accompanies a breakout above resistance, it confirms strength and may attract more buyers. Pakistani investors, especially during volatile periods—like festival seasons or economic announcements—should watch these volume bursts closely as they often precede notable price swings.
Paying attention to price levels, time frames, and volume ensures you are not just guessing but basing decisions on solid signals that reflect genuine market psychology.
By focusing on these key elements, your reading of gold trading charts becomes sharper, helping you navigate Pakistan’s unique market conditions effectively.
Understanding common patterns and indicators is vital for anyone serious about gold trading, as these tools help to decipher price actions and market sentiment more clearly. Instead of guessing based on hunches, traders can use these patterns to anticipate market moves, set entry and exit points, and manage risks more effectively. Pakistani investors, especially, benefit from mastering these tools given the volatility caused by rupee fluctuations and global uncertainties.
Drawing and using trend lines effectively involves connecting successive highs or lows on a gold chart to map the direction of price movement. A clean trend line helps traders spot the overall trend and potential reversal points. For example, if the gold price keeps bouncing off an upward trend line drawn from recent lows, it suggests buyer strength and support around those levels.
Identifying upward, downward, and sideways trends is crucial for timing trades. An upward trend indicates gold prices are generally rising, typically suitable for buying on dips. A downward trend reflects falling prices where traders may consider selling or avoiding long positions. Sideways or range-bound trends happen when prices fluctuate within a tight band, showing indecision; here, traders may wait for a clear breakout before taking the plunge.
Simple Moving Averages (SMA) calculate the average gold price over a chosen period, smoothing out daily fluctuations. Exponential Moving Averages (EMA) give more weight to recent prices, responding more quickly to market changes. Both are widely used to assess trend direction and momentum.
Traders often use moving averages for buy and sell signals. For instance, a common method is monitoring when a short-term moving average crosses above a longer-term one (a "golden cross"), signalling a potential uptrend. Conversely, if it crosses below (a "death cross"), it might indicate a downtrend. Pakistani investors trading on platforms like MT4 or investing in local gold markets find these signals useful to avoid premature decisions during sudden market jitters.
The Relative Strength Index (RSI) measures whether gold is overbought or oversold on a scale of zero to 100. Readings above 70 often suggest overbought conditions, warning of a possible price pullback, while below 30 points to oversold situations, hinting at a rebound. RSI helps avoid buying gold at price peaks or selling during dips only to miss out on recovery.
MACD (Moving Average Convergence Divergence) shows momentum and trend changes by comparing two moving averages. A MACD line crossing above the signal line can alert buyers to climb in, while crossing below warns of weakening momentum. This is particularly helpful during periods of high volatility, common in Pakistan’s gold market when global events shake prices.
Bollinger Bands plot a moving average with upper and lower bands representing volatility. When gold price touches or moves beyond these bands, it can signal an impending reversal or breakout. For example, during Eid when demand spikes, price may rapidly hit the upper band, signalling traders to watch closely for possible pullbacks.
Mastering these patterns and indicators bridges the gap between guesswork and informed trading decisions, especially in gold markets where external factors heavily influence price.
In sum, using trend lines, moving averages, and indicators such as RSI, MACD, and Bollinger Bands offers Pakistani traders a toolkit to read gold charts more effectively, spot opportunities, and manage risks confidently amid a fluctuating market landscape.
Gold price charts reflect not only technical movements but also real-world factors affecting supply, demand, and investor behaviour. Recognising these influences helps traders and investors read price shifts with clearer insight. Economic reports, political events, and local market dynamics each leave visible marks on gold charts, often creating sharp swings or steady trends. Understanding these drivers can sharpen your timing for entry or exit points in gold trading.
Inflation, interest rates, and geopolitical tensions have a direct bearing on gold prices. For instance, when inflation rises globally, gold often gains appeal as a hedge against currency erosion. Traders watch central bank announcements closely — an unexpected hike in interest rates can strengthen the dollar and cause gold prices to dip. Conversely, any uncertainty stirred by geopolitical tensions, like conflicts in the Middle East or trade disputes, tends to push gold upward as a safe haven.
Market sentiment amplifies these effects. Positive economic data may encourage risk-taking, leading to lower gold prices as investors move to equities. On the other hand, widespread fear or pessimism sparks demand for gold. This push and pull show clearly on charts as sharp rallies or sudden drops. Traders who follow news alongside chart signals stand a better chance of reading these shifts accurately.
In Pakistan, fluctuations in the Pakistani rupee impact gold prices visibly. When the rupee weakens against the US dollar, gold prices usually rise in local currency terms. This is because gold is globally priced in dollars, so a weaker rupee means Pakistani buyers need more rupees to purchase the same quantity of gold. For example, a significant depreciation of the rupee during economic uncertainty often causes immediate upticks in gold rates on local charts.
Import duties and seasonal demand, especially around festivals such as Eid and weddings, also affect price patterns. Higher import duties raise the cost of gold, leading to tighter price ranges or upward trends visible on charts. During festival seasons, increased buying interest pushes prices higher, sometimes precipitating short-term 'bull spikes'. Traders in Pakistan should keep an eye on customs announcements and festival calendars to judge likely demand surges that reflect on gold price charts.
Understanding both global and local factors alongside chart patterns can greatly improve your trading strategies, helping you anticipate price movements rather than just react to them.
By integrating economic news, political developments, and local market conditions with chart reading, you can approach gold trading with a more informed and confident perspective.
Using gold trading charts effectively helps traders and investors avoid guesswork when entering or exiting the market. Charts provide a visual summary of price movements, but their real value lies in combining technical signals with a broader understanding of market conditions. This balance allows you to make decisions that are not just reactive but grounded in observable patterns and confirmed by underlying factors.
Charts show price data and trends, but they cannot capture every market force affecting gold prices. That's why relying only on charts could lead you astray, especially during unexpected events like sudden geopolitical conflicts or policy shifts. For instance, a bullish chart pattern might look promising, but if a central bank unexpectedly raises interest rates, gold prices can quickly reverse.
Fundamental research fills this gap by monitoring news that shapes the gold market. Stay updated on inflation reports, currency fluctuations (especially the Pakistani rupee), and international trade relations. When you know that, say, inflation rates have jumped or the rupee has weakened, you understand why the gold chart behaves a certain way and can adjust your trades accordingly. This layering of chart analysis with fundamental insight sharpens your decision-making.
Choosing reliable charting platforms is crucial for accurate analysis. Platforms like Investing.com, TradingView, and local brokerage apps offer detailed gold charts with various technical tools. Ensure your chosen platform updates data in real-time and provides features such as multiple time frames and drawing tools. A lag in data or limited functionality can cause you to miss key signals.
Setting realistic targets and stop-loss points helps you control risk and secure profits. For example, if gold is trading at Rs 250,000 per tola, setting a stop-loss at Rs 245,000 limits potential losses if prices fall. Targets should be based on previous support and resistance levels visible on the chart. Overly ambitious targets can lead to missed exit points, while tight stops may cause unnecessary losses.
Risk management and diversification strategies protect your investment from volatile swings common in gold trading. Avoid putting all your capital into gold alone; consider spreading risk across other assets like equities or fixed income. Use position sizing to ensure no single trade affects your portfolio’s overall health. For Pakistan's market, where external factors like rupee fluctuations and festival demand influence gold, diversification cushions against sudden shocks.
Combining charts with good research and disciplined trade management makes your gold trading smarter and less stressful.
Invest wisely, use your charts wisely, and keep track of local and global factors to stay ahead in gold trading.
Learn how to pick the best Forex trading indicators 📈 for your strategy. Discover types, popular options & tips to improve your market moves.
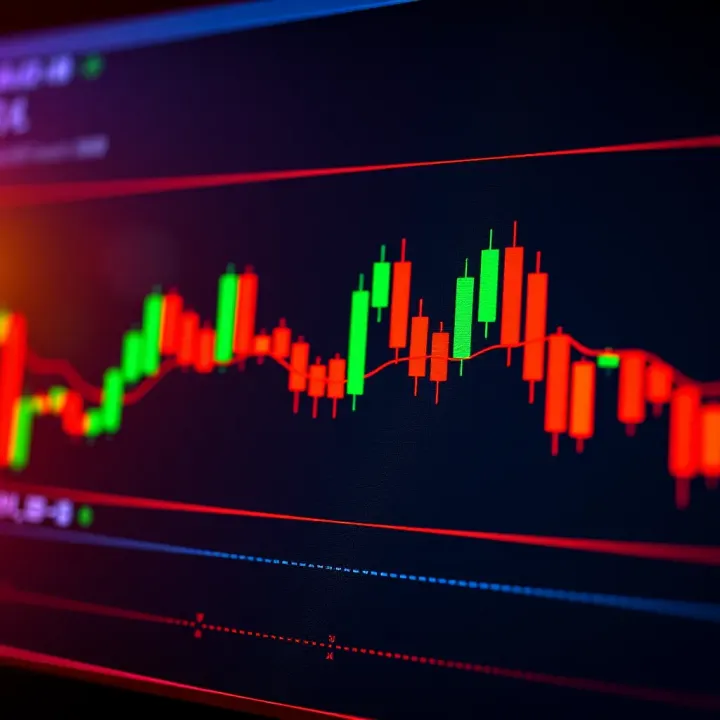
📊 Explore key candlestick patterns in trading—bullish, bearish, and neutral signals with examples. Master setups to sharpen your analysis and improve decisions!
🔢 Learn binary conversion basics, methods, and tools with examples. Understand its role in computing and tackle common challenges easily! 💻

📊 Explore top trading apps worldwide with a focus on Pakistan. Compare fees, security, tools, and support to find the best option for your trading needs.
Based on 12 reviews